(Welcome: we are now on a later and more updated thread, which can be found here: http://www.theoildrum.com/node/4525 NB: you may want to just go the front page (it will be post #1 or #2) to get to the most recent thread: http://theoildrum.com ...)
(all the maps and models moved under the fold to conserve bandwidth...scroll down)
Updated 9/12 2300 EDT--next update in the morning when we know more about where and how much power/wind was involved. Hurricane Ike's current track currently is headed directly for Houston/Galveston and is expected by the National Hurricane Center to be Category 2 (or perhaps a 3) at a late Friday/early Saturday am landfall, which remains in striking distance of over 5 million bpd of US petroleum refining capacity. (A little perspective: 5 MMBBL is about 30% of US capacity (about 15 MMBBL), and a bit less than 6% of global capacity (~85 MMBBL)).
The concern now is the where of landfall. If the storm continues further west before turning (see Chuck's update below), then Texas City/Baytown will be in a very bad place, and that's >1MMBBL all by itself. The next two maps represent the current NHC track (the further "left" the storm goes the worse it is for TX City and Baytown, note red storm surge in this track, Baytown is at the back of the bay) and the GFDL track below...as of this update the eye was wobbling to the left of the NHC track, which isn't a good thing for Texas City.
(all the maps and models moved under the fold to conserve bandwidth...scroll down)
[break]
(Welcome: we are now on a later and more updated thread, which can be found here: http://www.theoildrum.com/node/4525 NB: you may want to just go the front page (it will be post #1 or #2) to get to the most recent thread: http://theoildrum.com ...)
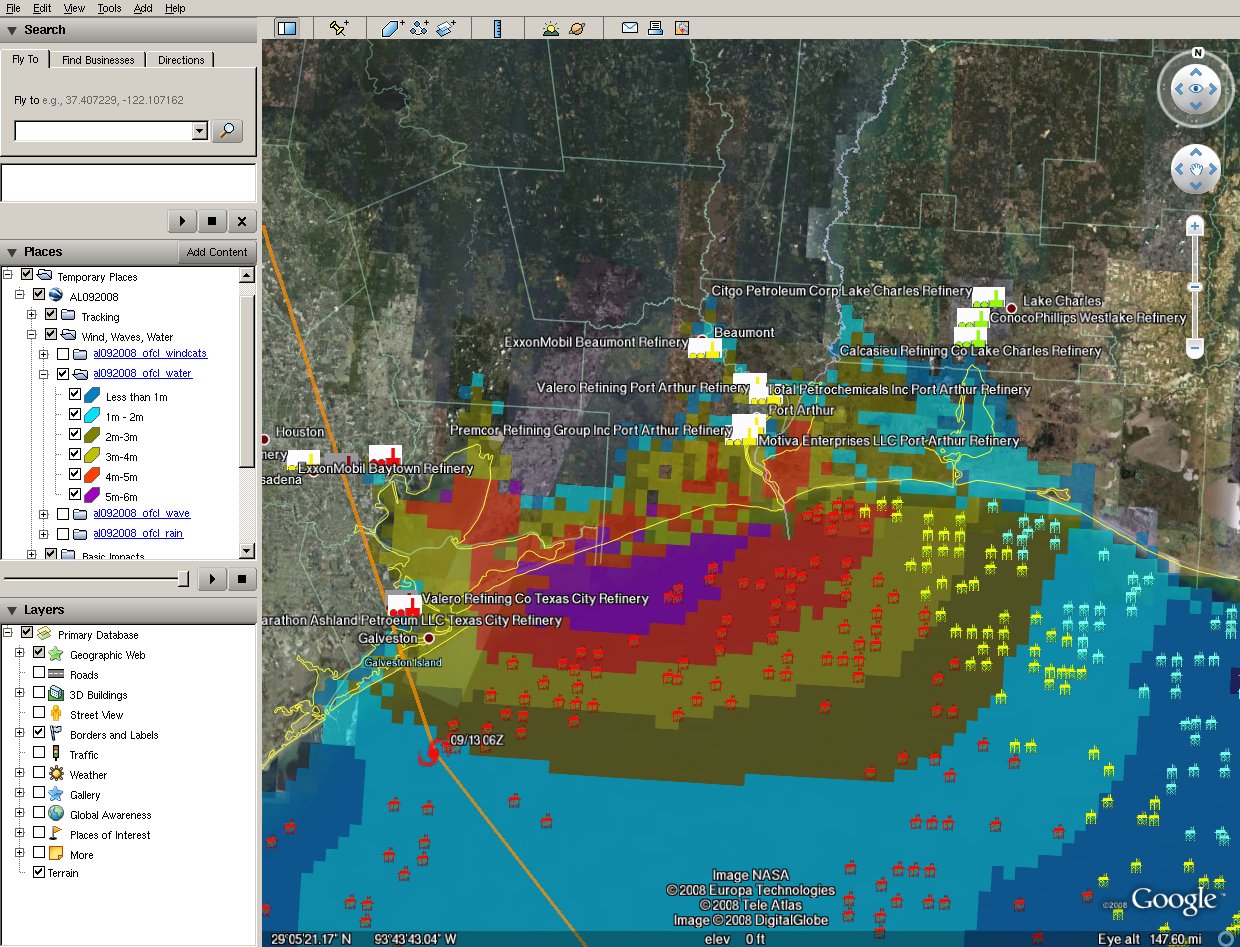
Current path estimates for Hurricane Ike (Methaz NHC official track Sep 12 (17:00 EDT)-click twice to enlarge--colors represent storm surge from SLOSH models, key on the side-you can see it if you enlarge.
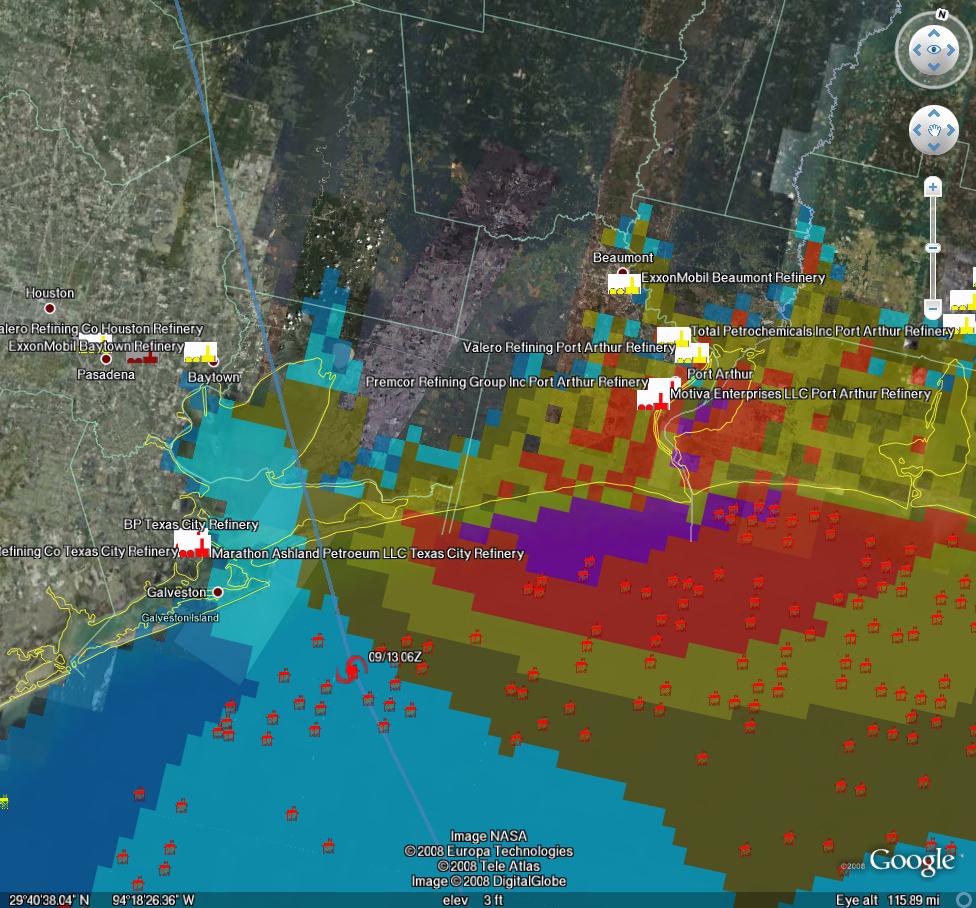
Current track map for Hurricane Ike (Methaz GFDL track Sep 12 (16:00 EDT)-click twice to enlarge--key for the slosh models is in the map above, enlarge it to see them.
For all graphics: Rigs/Platforms: Blue: evacuated only; Yellow will require inspection before restart; Red: damage requiring repair; Refineries: Black: operational impact (partial shutdown) Green: Operational impact (full shutdown) Red: Damage likely; Ports: standard hurricane flags for wind
Here is the latest update from Chuck Watson at KAC/UCF Chuck updating at 20:45 EDT:
Texas City is on the borderline. Water levels still rising, but if the storm resumes a NW trajectory Right Now it might not flood...much.
I don't think Ike is intensifying. Max FL winds on the latest passes were 103 knots, which gives surface winds of 90 knots. Buoy 42035, offshore from Galveston, has been holding steady at 45 knots. Winds at Texas City also holding at 35-40 knots. Water levels at Pleasure Pier are holding steady, and there are *very* preliminary signs the offshore winds at Baytown are starting the drop the water levels there. That's the good news. The bad news is the center of the vortex has been moving due west the last hour or so and is now basically on the NHC track. Hopefully it will turn back NW soon, or water will start blowing into the back of the bay again. Still cautiously non-pessimistic Baytown won't get serious flood damage.
Staying with three scenarios (relative to Galveston):
1) 20 miles west: Very Very Bad for Texas City. Very Bad for Baytown. Pt Arthur some damage but not so bad.
2) Direct Hit: Bad for Texas City, Baytown escapes worst of it. Bad for Pt Arthur.
3) 20mi east: Not so bad for Texas City. Baytown Escapes, Pt Arthur? Oh, you mean Lake Arthur.Remember that swath of heavy damage for most hurricanes, even intense ones, is only 50-75 miles wide. Also recall that damage is exponential - 110 mph winds may be 10% higher than 100 mph winds, but will cause 20% more damage.
as of Sep 12 (16:00 EDT):
Ike remains atypical in structure. Interestingly, the wave and wind fields are stronger on the back side of the storm than in the right front quadrant, due to wind and fetch considerations. The "eyewall" is visible on radar, and looks to make landfall on the north side of Galveston Bay, to the right of the current NHC track. Expect them to shift a bit north in the next advisory. Given this structure, I seriously doubt Ike can intensify much before landfall. However, the wide wave field and potential for 20ft storm surge along a wide stretch of coastline will still cause a lot of coastal damage.
The track and intensity forecast has enough confidence to start looking at very detailed impacts. Offshore, I'm not expecting much damage. The wave field, while extensive, is within the design margins of all but the older, less productive platforms. 30 ft waves sounds like a lot in the Gulf, and I wouldn't want to be out in it, but you have to get above 50 ft to really cause significant damage.
The refineries remain a significant concern. I'm less concerned about wind, unless we get unlucky and something breaks that shouldn't. The big question now is down to flooding, and the main facility I am worried about is the Texas City complex. If the storm tracks to the NE of the bay, and winds blow offshore, it may avoid flooding. But a leftward wobble could inundate this complex, and take out over 1 MMBBL/day capacity for several months. The big Exxon-Mobil Baytown complex is a bit better protected - the storm will have to take a significant leftward jog to flood it. It looks like Port Arthur area is in for big flooding if the current trends continue, but the refineries are further inland, and if the storm starts moving faster there may not be enough time for the surge to build inland.
30 Day Outage Probabilities (Refinery Capacity):
1 MMBBL: 70%
3 MMBBL: 30%
5 MMBBL: 10%
and from Calculated Risk and Tanta, here's a complete geek out for you, which is powered by hurricane-tracking software from Stormpulse.com. Check it out.
Also, the MMS reported today that:
97.5% of the oil production and 94.4 % of the natural gas production in the Gulf has been shut-in; Personnel have been evacuated from a total of 596 production platforms, equivalent to 83.1% of the 717 manned platforms in the Gulf of Mexico; Personnel from 101 rigs have also been evacuated--this is equivalent to 83.5% of the 121 rigs currently operating in the Gulf; that staff has been evacuated from 452 production platforms (63.0%) and 81 rigs (66.9%) – (95.9% of the oil production and 73.1% of the natural gas production has been shut-in as a precautionary measure for Hurricane Ike.)
We will be posting periodic updates of track and damage forecasts here, because one never knows if one of these events will be seminal. We're not hurricane experts at theoildrum.com. Thankfully we have an expert meteorologist who sends us track and damage forecasts relevant to oil and gas infrastructure. What we try to do on this site, (and have been doing for over 3 years), is articulate the fragility and urgency of our nation's, and our world's, energy situation. As Hurricane Ike moves nearer, and professional analysts gauge the impact it may have on our energy infrastructure, feel free to browse our archives of empirically based analyses and perspectives on the many aspects of our energy situation that form the backdrop not only for this hurricane, but for any exogenous event that disrupts the increasingly uneasy balance between energy supply and demand.
Here is a map of the critical pipeline structure expanding outward nationwide from the Houston/Port Arthur area:

NHC Forecast for Hurricane Ike - click to go to Wunderground
Here are depictions of various Texas cities storm surge maps under different Hurricane scenarios from Weather Underground.
Chuck Watson has put together a dynamically updating page that will reflect the latest damage models/forecasts at this link: KAC/UCF models. We will be updating this thread with damage estimate and breaking news as this story unfolds.
A note on our modeling process: we take the official NHC track, the raw computer model tracks like GFDL, HWRF, LBAR, etc, and even run our own in-house fast cycle track/intensity models. These track and intensity estimates are feed to our main hurricane model (TAOS), which computes the wind, waves, storm surge, currents, etc. at each point in our database of over 50,000 elements in the GoM like rigs, platforms, pipelines, pumping stations, refineries, etc. We then have engineering models for each type of infrastructure that calculates the damage and estimated down time for that element, as well as downstream impacts (eg if a pipeline is down, the upstream elements can't pump and the downstream elements don't get product).
PRODUCTION/INFRASTRUCTURE MAPS AND REFINERY INFORMATION
Here's a link to a really good map of oil refining/SPR storage facilities in respect to the path of Katrina (NB: OLD TRACK MAP!) and here is a listing of production and refining capability for the state of LA.
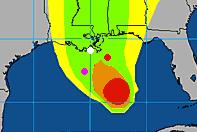
Just to give you a rough idea of where things are, the map above is a probability swath for Katrina (OLD TRACK MAP!) with the Thunder Horse platform as the red dot, and the other purple dot represents the Mad Dog development (100,000 bd); the Holstein development that produces at peak, around 100,000 bd of oil; and the Atlantis field that may have ramped up to around 200,000 bd in all. Put together these projects have the potential of around 650,000 bd, but as can be seen, they were sitting in an uncomfortable spot relative to the track of the Katrina.The white dot is where Port Fourchon is. This is where the Louisiana Offshore Oil Port, or LOOP, is located. Rigzone pointed out that this is where the foreign tankers offload, Google and Terraserve maps you can see that the area is very low-lying. One of the big concerns is that there will be sub-sea landslides or other ground movement that might affect the LOOP. Were this to be disrupted, then foreign tankers would need to be diverted elsewhere, with the likely port being Houston.
We have accumulated resources from previous hurricanes below, but we'd like to find updated materials if you know of them. Recent refinery maps, recent rig maps in the gulf, recent gas fields, SPR facilities, the Intercoastal Canal, pipeline stations and transfer points, etc., etc. Leave links in the comments please.
Also, here's the EIA's Alabama, Louisiana, Mississippi, and Texas Resources pages. They will also likely come in handy. Also, here's a link to the national page.
Here's another good resource for infrastructure maps and such. (scroll down a bit)
Here's a map from CNN with large and small refineries laid out. (though it is an old storm track)
Very detailed piece by RIGZONE on rigs and other infrastructure in the area. (thanks mw)
Here's a flash graphic of the oil refineries and rig maps from Hurricane Rita, it emphasizes Beaumont and Galveston's importance. Click on oil production in the tab. Note the many rigs on the east side of the storm that will get the brunt of the damage from the NE quad of the storm...hence the high long-term GOMEX oil production damage estimates below.
Here's a link to Rigzone's coverage of Ike.
You want a detailed map? Well here's the probably the best MMS map I could find. Very detailed and lots of interesting stuff. (VERY big .pdf warning)
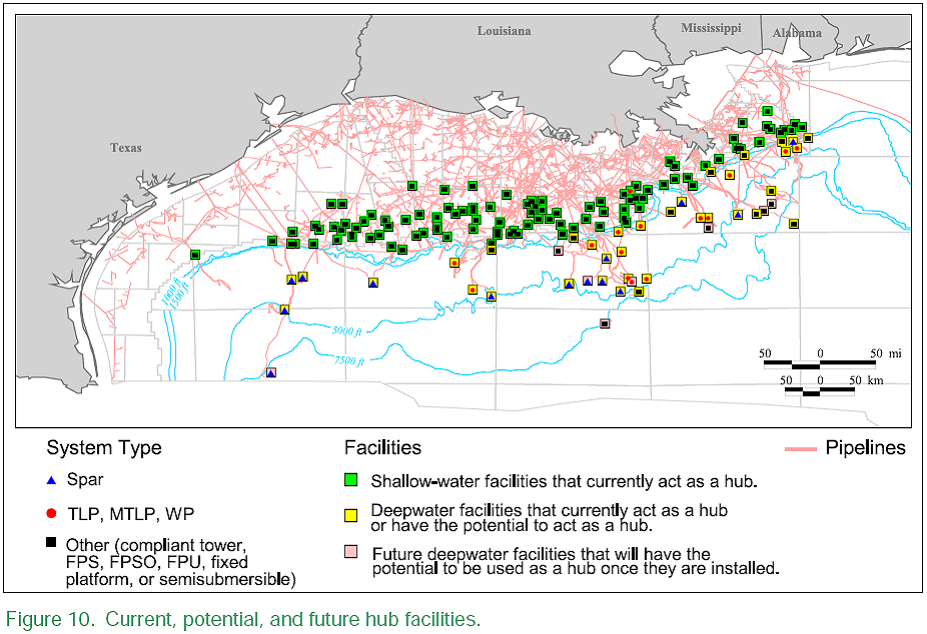
Also, Scott Wilmoth at Simmons & Co sent us this map on deepwater infrastructure. For a complete list of deepwater development systems (includes operator, depth, location): http://www.gomr.mms.gov/homepg/offshore/deepwatr/dpstruct.html
(Please deposit new relevant links, graphs, and comments in this new thread...we have updated the resources part of this post with new maps and some more old maps and articles from Katrina on the LOOP and Port Fourchon--important parts of the infrastructure, as we learned about three years ago. Please leave personal anecdotes and themes unrelated to hurricane for the other upcoming 'bigger picture' posts, as some of these larger images are difficult to upload for those on dial-up)
We will be posting continued updates of track and damage forecasts here, because one never knows when one of these events may have more than just local impacts. We're not hurricane experts at theoildrum.com. Thankfully we have an expert meteorologist who sends us track and damage forecasts relevant to oil and gas infrastructure. What we try to do on this site, (and have been doing for over 3 years), is articulate the fragility and urgency of our nation's, and our world's, energy situation. As Hurricane Ike moves nearer, and professional analysts gauge the impact it may have on our energy infrastructure, feel free to browse our archives of empirically based analyses and perspectives on the many aspects of our energy situation that form the backdrop not only for this hurricane, but for any exogenous event that disrupts the increasingly uneasy balance between energy supply and demand.i>


